The first half of 2022 will be a time that investors will be eager to forget. The S&P 500, the US’s benchmark stock index, lost a fifth of its value – the worst first half since 1970.
The grim milestone reflects a variety of worries. Stubbornly high inflation – which hit a 40-year high of 8.6% for the year to May – raises a series of challenges for stock markets. Most obviously, it is leading to rapid interest rate rises from the Federal Reserve, which hiked it by 75 basis points in June, the largest move since 1994.
This has been lifting the cost of borrowing for both companies and their customers – and looks likely to slow earnings growth this year and beyond.
The big question for chief financial officers and other executives is how long the weakness will last
Second, higher rates have been pushing up the interest rate on government bonds. The yield on the 10-year US Treasury climbed from 1.6% at the start of the year to around 3% by 30 June – increasing the appeal of safe government bonds compared to riskier equities.
The shift also reduces the value investors place on future profits in discounted cashflow models – a tool analysts use to assess the value of a company on the stock market.
This is a particular problem for technology companies – whose valuations often rest on profits that investors expect in the distant future. The rise in government bond yields thus helps explain why the technology-heavy Nasdaq index had an even worse first half than the S&P 500, falling 29.5% in the first half versus 20.6% for the broader index.
Bad for business
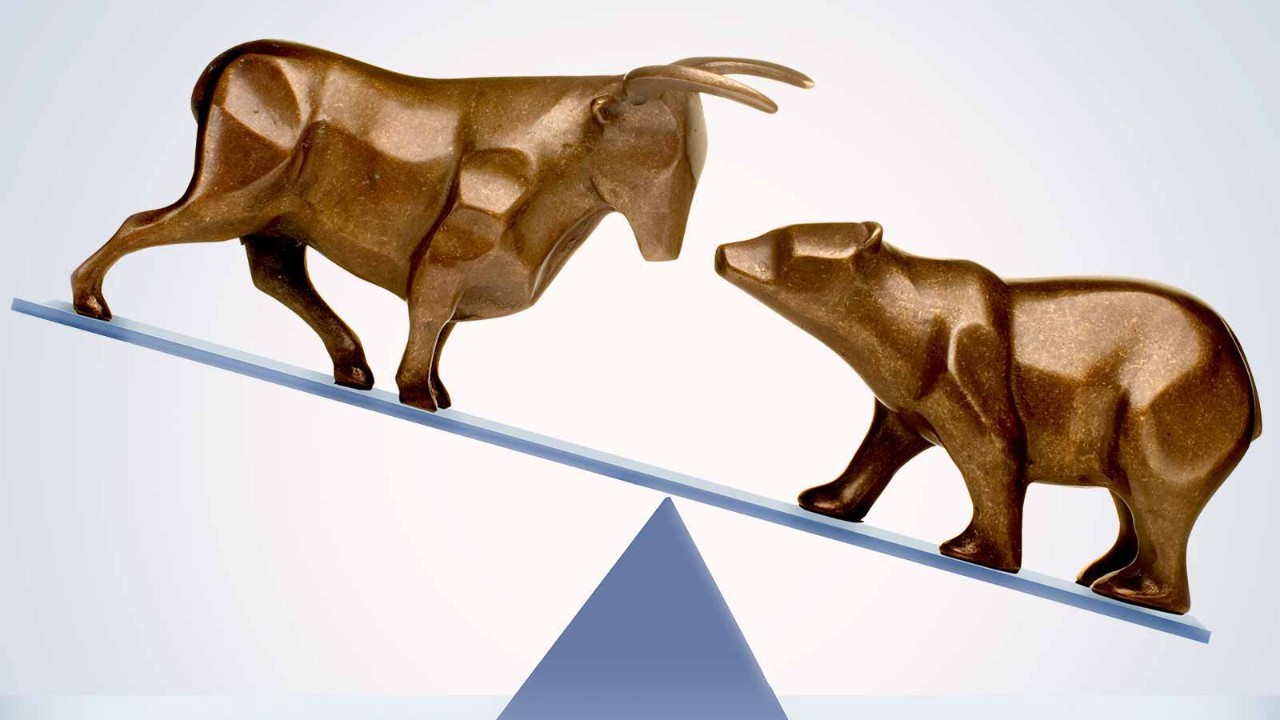
But this bear market – commonly defined as a 20% fall from a prior peak – is not just bad news for investors. It also affects the ability of businesses to raise money on the stock market, whether to expand their operations or to develop new products.
This is already showing up in the data. US equity fund raising fell almost 90% in the first half of 2022 versus the same period last year, plunging from $327bn to just $40bn – which was the lowest sum raised since 1999, according to data from Refinitiv.
And a mounting reluctance by investors to buy risky assets made it harder to raise money in bond markets – especially for companies with a credit rating of BB or below, assessed by rating agencies to carry a higher threat of default.
Sales of such high yield bonds fell from over $250bn in the first half of 2021 to $60bn so far this year, the poorest start to a year since 2009. With such high stakes, the big question for chief financial officers and other executives is how long the weakness will last.
History might provide some ballpark estimates. So far, stocks have been on a falling trend for six months, having reached an all-time peak in the first days of January. If the past is any guide, more is in store.
Based on data going back to 1947, once US stocks start falling from a peak, the decline has continued for just over a year on average. It then takes an additional two years to recover the loss and get beyond the prior highs – for a full recovery time of just over three years.
Worst to come?
In addition, history suggests that the worst may be yet to come in terms of the size of the decline. The average for a bear market has been around 33%, again based on data going back to 1947 – versus around 20% so far in the present decline.
Of course, these averages conceal wide divergences. In the bear market of 2008, for example, the market fell by a maximum of 51%, erasing the gains of the prior 11 years. It also took the S&P 500 over four years to fully recover the loss.
There is less hot air to remove from the market
Meanwhile, the S&P 500 took more than six years to fully recover from the collapse following the dotcom bubble in 2001. In contrast, the downturn precipitated by the 2020 pandemic holds the record for the shortest drawdown, with the market taking just six months to rebound and start hitting new highs again.
The main determinants of how aggressive the bear market is this time will likely hinge on two main factors. The first is how excessive valuations have become. There is some positive news here. The slide in stocks in the first half of 2022 has already taken one metric of valuations – the 12-month trailing price-to-earnings ratio – to just 17 times.
That is only slightly above the 16.2 times average since 1960, based on an analysis of Bloomberg data by UBS. The upshot is that there is less hot air to remove from the market. For comparison, trailing price-to-earnings ratios reached close to 30 times during the dotcom bubble.
Less profound problems
The second determinant is the depth of the economic downturn that accompanies the stock market decline. This in turn can depend on the severity of the economic or financial imbalances that need to be resolved – such as excess debt, problems for the banking system, or the overvaluation of assets such as housing.
Again, most economists argue that the problems in 2022 are less profound than in either 2000 or 2008. We have not seen the irrational surge in business investment that occurred during the dotcom boom – when spending on technology got out of hand. And, compared to 2008, financial institutions are significantly better capitalised.
Meanwhile, household balance sheets are in far better shape. With a net worth of $149 trillion, even allowing for $18.6 trillion of debt, Americans have added close to $80 trillion to their wealth over the past decade, based on Federal Reserve data. That compares to a net worth of around $85bn ahead of the Great Financial Crisis.
Overall, then, history, current equity valuations and the underlying health of the economy would argue for a relatively brief and shallow bear market in equities.
However, this could still mean months of more gloom for investors. And if inflation proves harder to combat than currently expected, a deeper and more painful downturn remains on the cards.


